
(2018) How Much do I use my Phone?
Towards the end of 2017, I started using an iOS app called Moment, which tracks how much time you spent on your phone each day and how many times you pick it up. Through using this application for the year of 2018 and poking around in the app for a way to export my day-by-day data, I was able to obtain a JSON file consisting of my phone usage time and number of pickups for every day of the year.
I decided to do some exploring to figure out just how much I’ve been using my phone on a daily basis, and see if there are any daily, weekly, or monthly differences - i.e. did I use my phone more on the weekends or on the weekdays? What follows is a Jupyter notebook that I created for analyzing this data and coming up with some plots, as well as a bit of analysis.
# imports
import json
import numpy as np
from datetime import datetime
import matplotlib.pyplot as plt
%matplotlib inline

# a class to manage the phone usage data for a particular day
class Day:
    def __init__(self, day_dict):
        self.minutes = day_dict['minuteCount']
        self.pickups = day_dict['pickupCount']
        # get the date and save if it is a weekday or not
        self.date = day_dict['date'].split('T')[0]
        self.is_weekday = datetime.strptime(self.date, '%Y-%M-%d').weekday() < 5

    def __repr__(self):
        return 'minutes: {0}, pickups: {1}, date: {2}'.format(self.minutes, self.pickups, self.date)

# open and deserialize json, convert into day objects
with open('data/moment.json') as f:
	data = json.load(f)

day_data = next(iter(data.values()))
days = [Day(d) for d in day_data]
# filter out non 2018
days = [d for d in days if '2018' in d.date]
Here is what some of the raw JSON data coming from the Moment app looks like:
print(day_data[0])
{'pickupCount': 69, 'pickups': [], 'date': '2018-12-30T00:00:00+11:00',
'minuteCount': 181, 'appUsages': [], 'sessions': []}
To attempt to understand the overall data, we can find the mean and standard deviation of how many minutes per day I used my phone, as well as plot a histogram.
minute_data = [d.minutes for d in days]
mean_time, time_std = np.mean(minute_data), np.std(minute_data)
# hourly bins
bins = [i for i in range(0, max(minute_data) + 60, 60)]

# plot overall usage
n, bins, _ = plt.hist([minute_data], bins=bins)
plt.xlabel('Minutes of Phone Usage')
plt.xticks(bins)
plt.ylabel('Frequency (# of Days)')
plt.title('Histogram of Phone Usage Time')
plt.text(300, 50, r'$\mu={0:.2f},\ \sigma={1:.2f}$'.format(mean_time, time_std))
plt.grid(True)
plt.show()

# hour-by-hour data
bin_ranges = [(bins[i], bins[i+1]) for i in range(len(bins)-1)]
hours_to_num_days = dict(zip(bin_ranges, n))
for k, v in sorted(hours_to_num_days.items()):
    print('Between {0} and {1} hours of usage: {2} days'.format(k[0]/60, k[1]/60, int(v)))
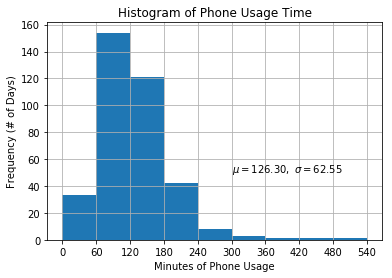
Between 0.0 and 1.0 hours of usage: 33 days
Between 1.0 and 2.0 hours of usage: 154 days
Between 2.0 and 3.0 hours of usage: 121 days
Between 3.0 and 4.0 hours of usage: 42 days
Between 4.0 and 5.0 hours of usage: 8 days
Between 5.0 and 6.0 hours of usage: 3 days
Between 6.0 and 7.0 hours of usage: 1 days
Between 7.0 and 8.0 hours of usage: 1 days
Between 8.0 and 9.0 hours of usage: 1 days
It looks like I spent an average of about 2 hours and 6 minutes on my phone each day, with a standard deviation of 1 hour and 2 minutes. This is slightly lower than the average time per day spent on their phones by American adults, which comes in at 2 hours and 51 minutes.
In other words, I spent about 8.75% of my entire day on my phone. If you only consider waking hours and assume 8 hours of sleep per day, then I spent about 13% of my waking hours using my phone each day. Translated to a year, this means I spent a whopping 766.25 hours on my phone in 2018, or 31.93 days - more than an entire month!
Another interesting thing to look at is the variability in my phone usage. Most days, I was around one to three hours of phone usage per day - this accounts for about 75% of all days of the year. However, there were a couple days with more than 6+ hours of phone usage per day, which increased the variability in my phone usage. Looking back, I think that this makes sense, as I do use my phone a lot on days when I’m traveling or on a road trip, or if I’m just really bored that day and don’t feel like doing anything else.
Let’s look at some more data, such as whether there’s a difference between weekdays and weekends.
# separate weekdays and weekends, and plot each
weekdays = [d.minutes for d in days if d.is_weekday]
weekends = [d.minutes for d in days if not d.is_weekday]
weekday_mean, weekend_mean = np.mean(weekdays), np.mean(weekends)
weekday_std, weekend_std = np.std(weekdays), np.std(weekends)

n, bins, _ = plt.hist(weekdays, bins=bins)
plt.xlabel('Minutes of Phone Usage on Weekdays')
plt.xticks(bins)
plt.ylabel('Frequency (# of Days)')
plt.title('Weekday Phone Usage Time')
plt.text(300, 50, r'$\mu={0:.2f},\ \sigma={1:.2f}$'.format(weekday_mean, weekday_std))
plt.grid(True)
plt.show()

n, bins, _ = plt.hist(weekends, bins=bins, facecolor='orange')
plt.xlabel('Minutes of Phone Usage on Weekends')
plt.xticks(bins)
plt.ylabel('Frequency (# of Days)')
plt.title('Weekend Phone Usage Time')
plt.text(300, 12, r'$\mu={0:.2f},\ \sigma={1:.2f}$'.format(weekend_mean, weekend_std))
plt.grid(True)


plt.show()
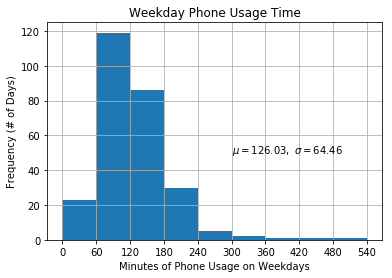
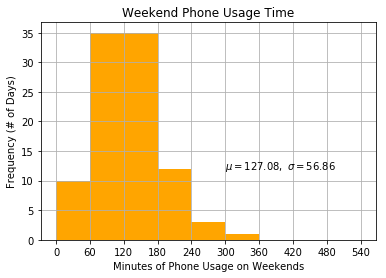
This was really interesting to me - the distributions for my weekday and weekend phone usage are quite similar, indicating that there’s little difference in my phone usage on a weekend or weekday. This ran counter to my hypothesis that I’d use my phone a lot more on weekends, given that I don’t have class or work. Next, lets see if there’s any difference in phone usage on different days of the week, different weeks, and different months.
# separate each day of the week, and plot each.
mon = [d.minutes for d in days if datetime.strptime(d.date, '%Y-%M-%d').weekday() == 0]
tues = [d.minutes for d in days if datetime.strptime(d.date, '%Y-%M-%d').weekday() == 1]
wed = [d.minutes for d in days if datetime.strptime(d.date, '%Y-%M-%d').weekday() == 2]
thurs = [d.minutes for d in days if datetime.strptime(d.date, '%Y-%M-%d').weekday() == 3]
fri = [d.minutes for d in days if datetime.strptime(d.date, '%Y-%M-%d').weekday() == 4]
sat = [d.minutes for d in days if datetime.strptime(d.date, '%Y-%M-%d').weekday() == 5]
sun = [d.minutes for d in days if datetime.strptime(d.date, '%Y-%M-%d').weekday() == 6]

def plot(data, title):
    global bins
    n, bins, _ = plt.hist(data, bins=bins)
    plt.title(title)
    plt.xticks(bins)
    plt.ylabel('Frequency (# of Days)')
    plt.xlabel('Phone Usage Time')
    plt.text(300, 12, r'$\mu={0:.2f},\ \sigma={1:.2f}$'.format(np.mean(data), np.std(data)))
    plt.grid(True)
    plt.show()


plot(data=mon, title='Minutes of Phone Usage on Monday')
plot(data=tues, title='Minutes of Phone Usage on Tuesday')
plot(data=wed, title='Minutes of Phone Usage on Wednesday')
plot(data=thurs, title='Minutes of Phone Usage on Thursday')
plot(data=fri, title='Minutes of Phone Usage on Friday')
plot(data=sat, title='Minutes of Phone Usage on Saturday')
plot(data=sun, title='Minutes of Phone Usage on Sunday')

# plot overall for mean comparison
means = [np.mean(x) for x in [mon, tues, wed, thurs, fri, sat, sun]]
print(means)
plt.bar(range(0,7), means)
plt.title('Average Phone Usage for Day of Week')
plt.ylabel('Average Phone Usage')
plt.xlabel('Day of Week')
plt.show()
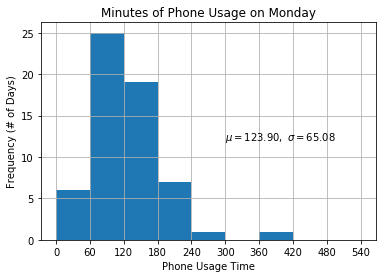
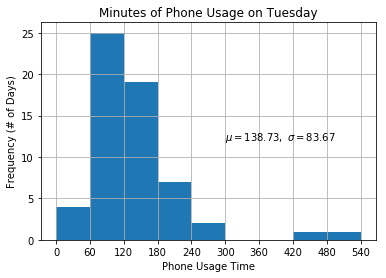
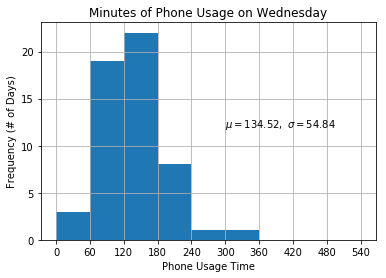
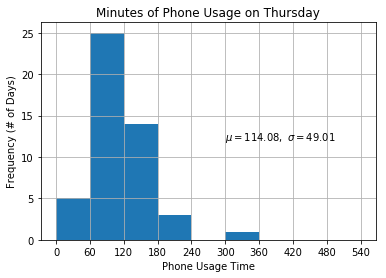
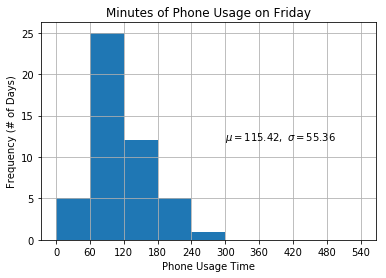
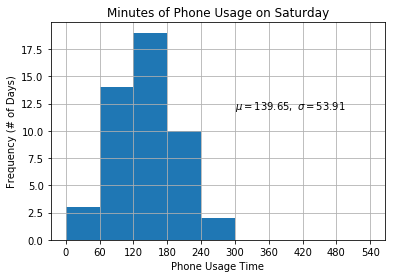
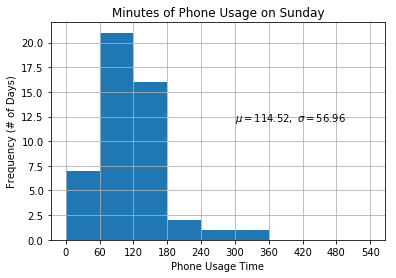
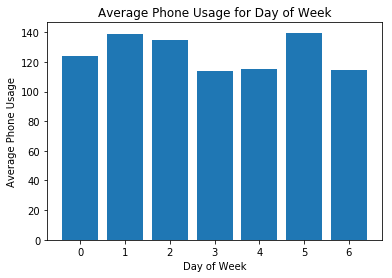
We can see that there’s a lot of similarity between the days of the weeks, though it looks like on average, I use my phone less on Thursdays, Fridays, and Sundays, while I use it comparatively more on Tuesdays, Wednesdays, and Saturdays. Overall, we can see that each day’s distribution is similar, taking on a mean of around two hours and a standard deviaton of around an hour. Let’s examine weekly usage now.
# extract weeks from the year by sorting days and going by sevens
ordered_days = list(reversed(days))
weeks = [ordered_days[i:i+7] for i in range(0, len(ordered_days), 7)]
weekly_usages = [sum(d.minutes for d in week) for week in weeks]
# plot each week's usage in a bar graph
plt.bar([i for i in range(len(weekly_usages))],weekly_usages)
plt.xlabel('Week of the Year')
plt.ylabel('Phone Usage Minutes')
plt.title('Week-by-Week Phone Usage Minutes')
plt.show()
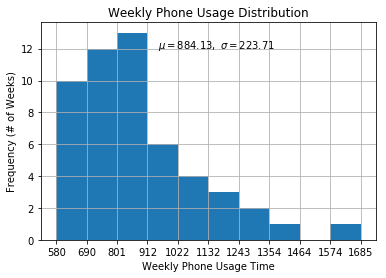
# plot weekly usage histogram
n, bins, _ = plt.hist(weekly_usages)
plt.title('Weekly Phone Usage Distribution')
plt.xticks(bins)
plt.ylabel('Frequency (# of Weeks)')
plt.xlabel('Weekly Phone Usage Time')
plt.text(950, 12, r'$\mu={0:.2f},\ \sigma={1:.2f}$'.format(
np.mean(weekly_usages), np.std(weekly_usages)))
plt.grid(True)
plt.show()
max_weekly, min_weekly = max(weekly_usages), min(weekly_usages)
print('{} minutes in highest-usage week, {} minutes in lowest-usage week'.format(
max_weekly, min_weekly))
1685 minutes in highest-usage week, 580 minutes in lowest-usage week
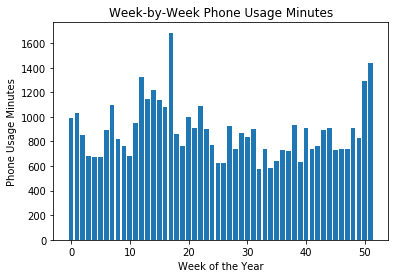
This is pretty interesting - it looks like my phone usage clustered around the 700-900 minute range for many weeks, with frequent spikes up to the 1100+ minute range in a couple of the weeks. My highest-usage week was a whopping 1685 minutes, or over 28 hours, or more than an entire day of the week spent solely on my phone. Finally, let’s move on to monthly usage.
# parse months out of dates, and get those days corresponding to the month
months = list(set(["-".join(day.date.split("-")[0:2]) for day in ordered_days]))
month_to_days = {int(month.split("-")[1]):
	[day for day in ordered_days if month in day.date] for month in months}

# plot bar graph of monthly means
monthly_means = [np.mean([day.minutes for day in li]) for li in list(month_to_days.values())]
plt.bar(list(month_to_days.keys()), monthly_means)
plt.xlabel('Month (1 = Jan)')
plt.ylabel('Average daily minutes of phone usage')
plt.title('Average daily minutes of phone usage per month')
plt.xticks(list(range(1,13)))
plt.show()

# plot histograms of most and least used months.
most_use_month, least_use_month = np.argmax(monthly_means) + 1, np.argmin(monthly_means) + 1

most_use_days, least_use_days = month_to_days[most_use_month], month_to_days[least_use_month]
most_use_mins = [day.minutes for day in most_use_days]
least_use_mins = [day.minutes for day in least_use_days]

def plot(month, mins):
    bins = [i for i in range(0, max(mins) + 60, 60)]
    n, bins, _ = plt.hist(mins, bins)
    plt.xlabel('Minutes of Phone Usage')
    plt.xticks(bins)
    plt.ylabel('Frequency (# of Days)')
    plt.title('Histogram of Phone Usage Time: Month {0:02d}'.format(month))
    plt.text(300, 5, r'$\mu={0:.2f},\ \sigma={1:.2f}$'.format(np.mean(mins), np.std(mins)))
    plt.grid(True)
    plt.show()

plot(most_use_month, most_use_mins)
plot(least_use_month, least_use_mins)
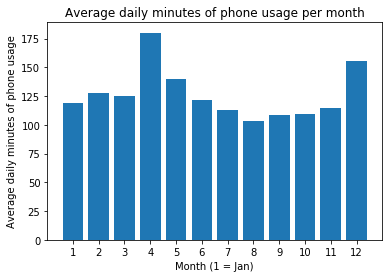
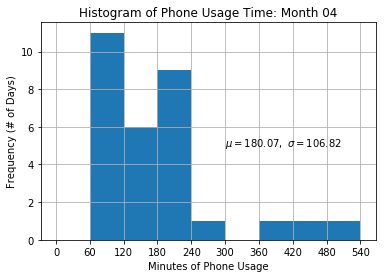
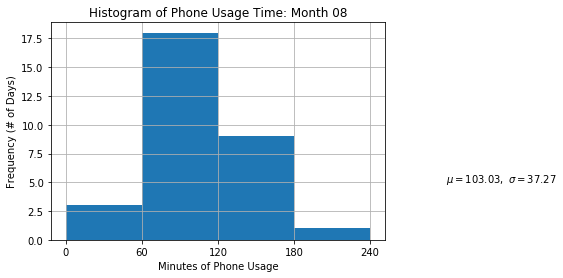
It looks like my monthly phone usage was consistent, hovering around the slightly above two hour mark, with a dip during the summer months and an increase during April and December. Over April, I used my phone for slightly over three hours a day on average (nearly 19% of my waking hours!) while using my phone for 1 hour and 43 minutes, or 10.7% of my waking hours, in the least-used month of August.
To be fair, the month of April had a large amount of variability, so the mean of 3 hours doesn’t really reflect my usual usage that month: April contained all three of the outliers in the entire year, where I used my phone for more than 6 hours. Honestly, I’m not too sure what may have happened, I either left my phone on accidently at some points during the month or more realistically just used my phone a lot those couple of days.
Concluding Remarks
The data indicates that my phone occupies a pretty significant chunk of my waking hours on an average day. I knew, like many people, that I used my phone a lot, but I didn’t quite understand how much until I actually looked at the data. However, this data doesn’t capture more granular information of whether I’m using my phone for more “useful” purposes such as necessary communication, homework/work-related stuff, calling a lyft/uber, getting directions, or talking on the phone, versus more typical time wasters (randomly checking social media/email for the 10000th+ time or just browsing around).
The overall takeaway for me is to think of my phone more as a tool, instead of as a distraction for when I’m bored. Phones and applications can be incredibly useful in keeping us connected with our friends and family, getting from place to place, learning new things, or capturing incredible moments, but can also take away from the present moment.
In 2019, I’m going to make a conscious effort to simply note when I use my phone immediately when boredom presents itself, such as during a long car ride, waiting for an elevator, or even just walking from place to place. Hopefully, this will make me more mindful when I use my phone to distract myself from the present moment, and in time, I can learn to turn off this deeply ingrained habit. Here’s to being more present in 2019.